Step 10 of 11 (91% complete)
Monitoring the results
Step Code
The code for this specific step can be found on the following branch:
Monitoring the Experiments
Once experiments are running, it’s important to monitor them to ensure that data is being collected correctly and that results are visible in the Optimizely dashboard. Monitoring helps validate that both event tracking and experiment assignment are working as expected before analyzing results.
1. Checking Experiment Reports in Optimizely
In the Optimizely Feature Exp Admin Panel, the Reports tab provides insights into your experiment:
-
How many users have been exposed to each variation.
-
Which variation is currently performing better.
-
Whether data is flowing correctly into the system.
It is recommended to first confirm that events are being received in the Reports tab to ensure that your experiment is properly configured.

2. Previewing Experiments with Vercel Toolbar
When hosting your application on Vercel, you can use the Vercel Toolbar to simulate and test experiments as end users would see them. This allows you to:
-
Force specific variations of feature flags.
-
Verify that experiment logic is wired correctly.
-
Debug issues without waiting for real user assignments.
To enable the Vercel Toolbar, you need to create a dedicated API route that exposes your configured feature flags.
3. Adding the API Route for Feature Flags
Create the file:
app/.well-known/vercel/flags/route.ts
// app/.well-known/vercel/flags/route.ts

import * as flags from '../../../../flags'
import { getProviderData, createFlagsDiscoveryEndpoint } from 'flags/next'

export const dynamic = 'force-dynamic'

// This function handles the authorization check for you
export const GET = createFlagsDiscoveryEndpoint(async () => {
  // your previous logic in here to gather your feature flags
  const apiData = getProviderData(flags)

  // return the ApiData directly, without a NextResponse.json object.
  return apiData
})
Explanation:
-
import * as flags from '../../../../flags'→ Imports all feature flags configured in your project. -
getProviderData(flags)→ Converts your flags into a format that the Vercel Toolbar can consume. -
createFlagsDiscoveryEndpoint→ Wraps your logic with built-in authorization handling and exposes the endpoint. -
export const dynamic = 'force-dynamic'→ Ensures the route is always dynamic so that fresh data is returned.
Once deployed, the endpoint will be available under:
/.well-known/vercel/flags
This endpoint feeds the Vercel Toolbar with your active feature flags.
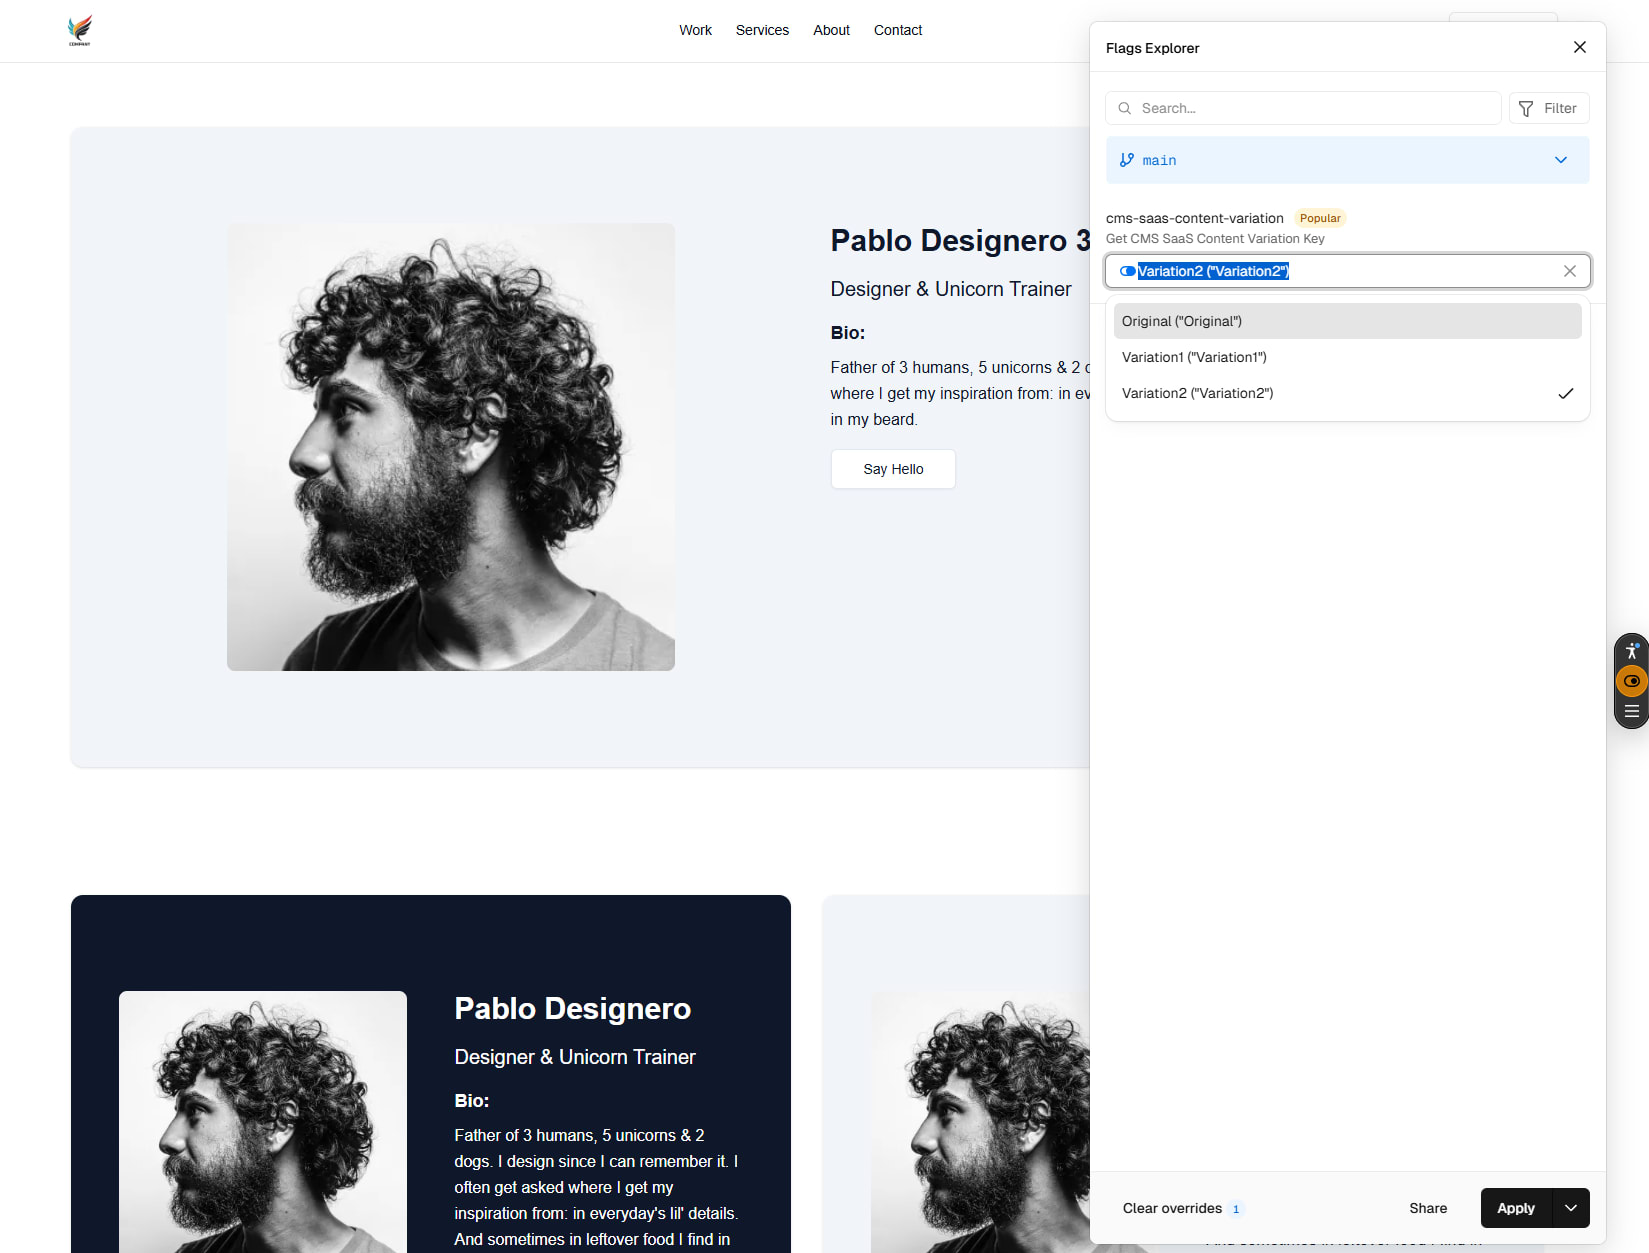
4. Overriding Flag Values in the Toolbar
With the toolbar enabled, you can:
-
Select which variation of a flag to preview.
-
Override Optimizely Feature Experimentation results on-demand.
-
Test different user scenarios quickly without modifying code.
Example of flag override in Vercel Toolbar:
Summary
Monitoring experiments involves two steps:
-
Validate data flow in the Optimizely Reports tab to ensure experiments and events are being tracked.
-
Use the Vercel Toolbar to preview and override variations, making it easier to test and debug experiments in a live environment.
This combination provides both high-level visibility and low-level debugging, ensuring your experiments are running correctly before analyzing performance results.
Have questions? I'm here to help!